Data Visualisation
In the data visualization modules, it possible to compare the results of the different foreward forecast. There is a well filter that allows the selection of wells depending the sort categories that has been provided when loading the data.
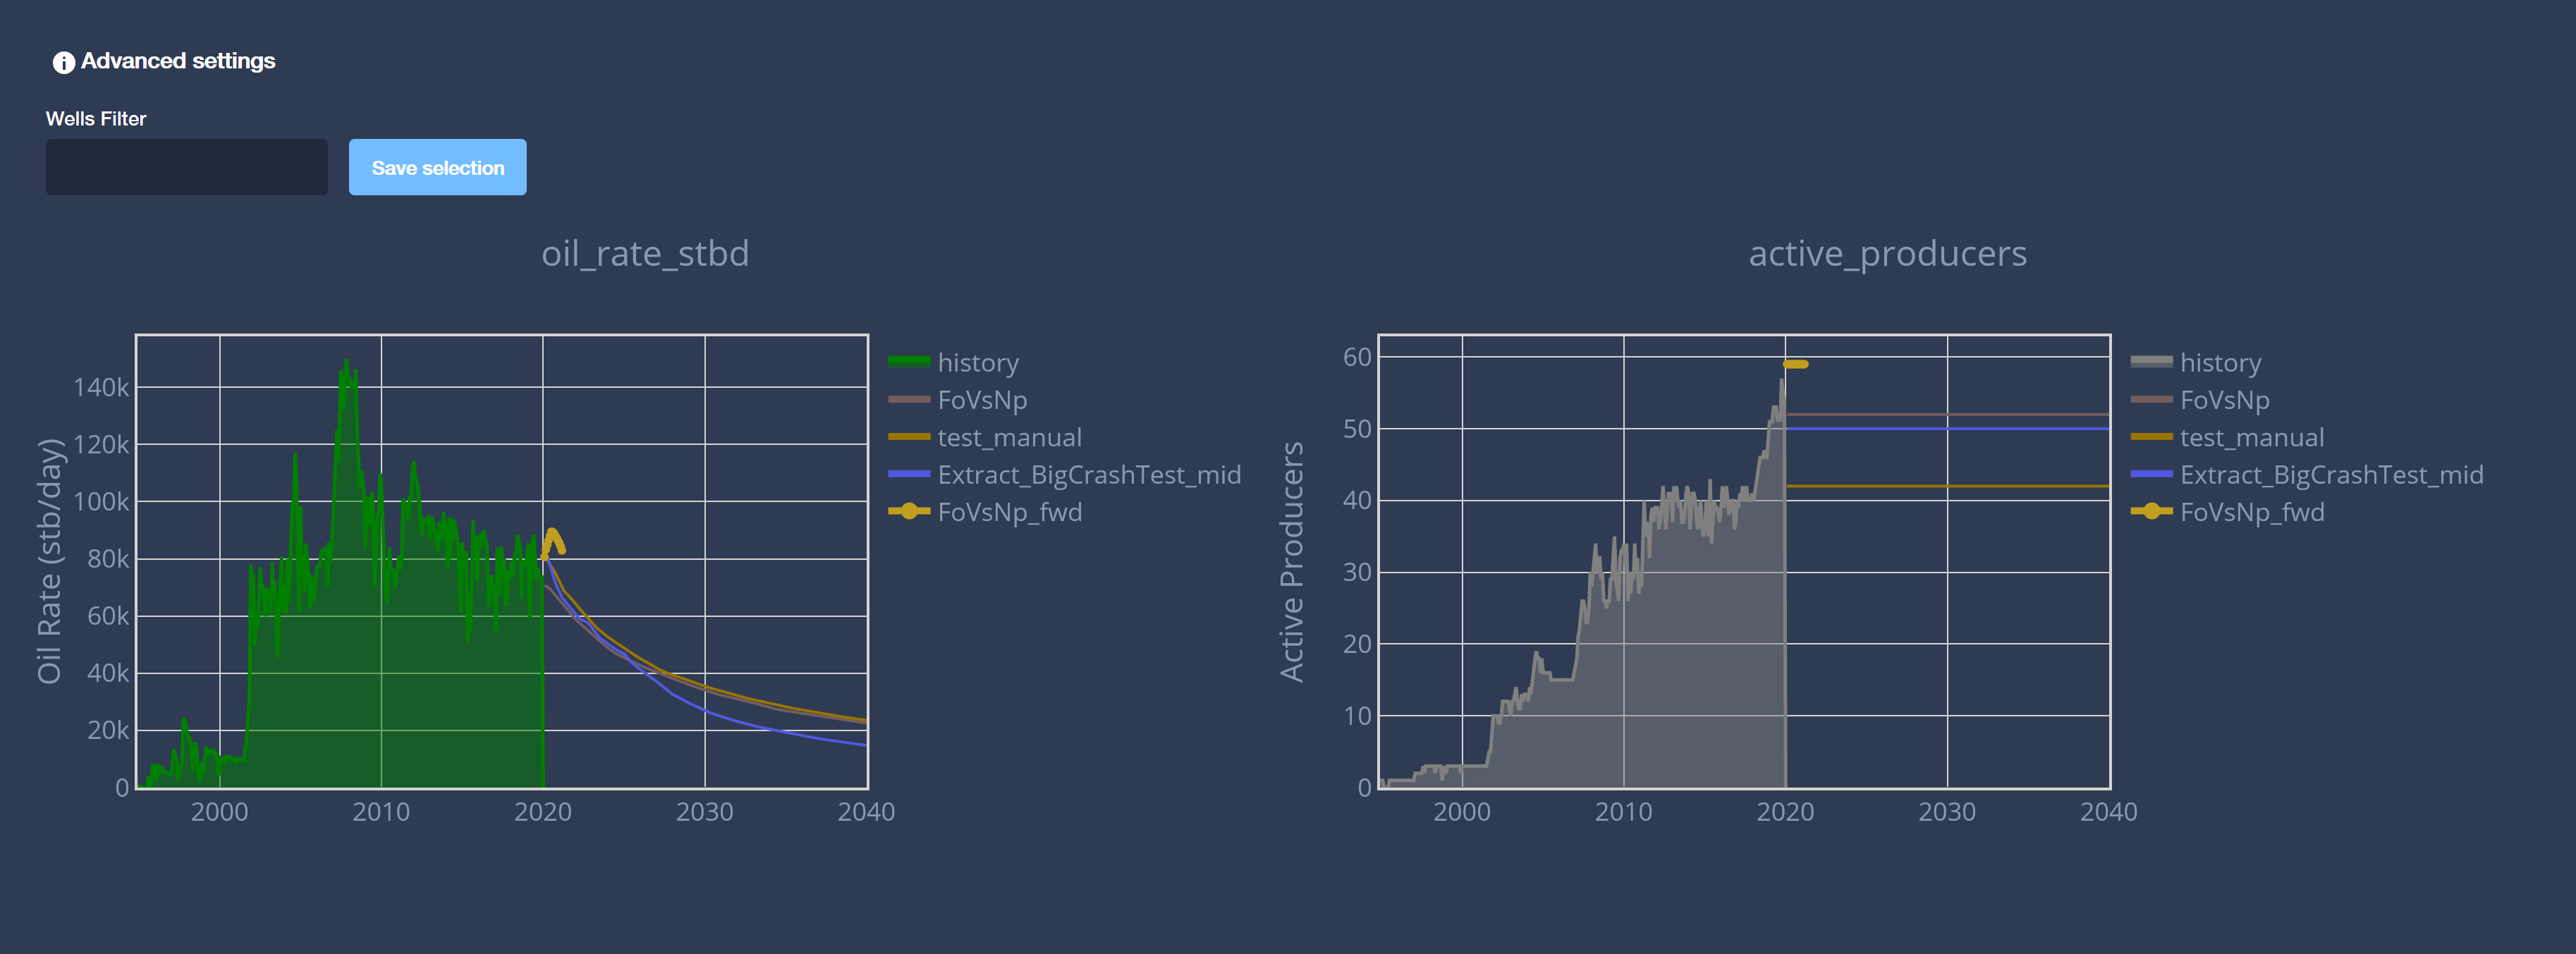
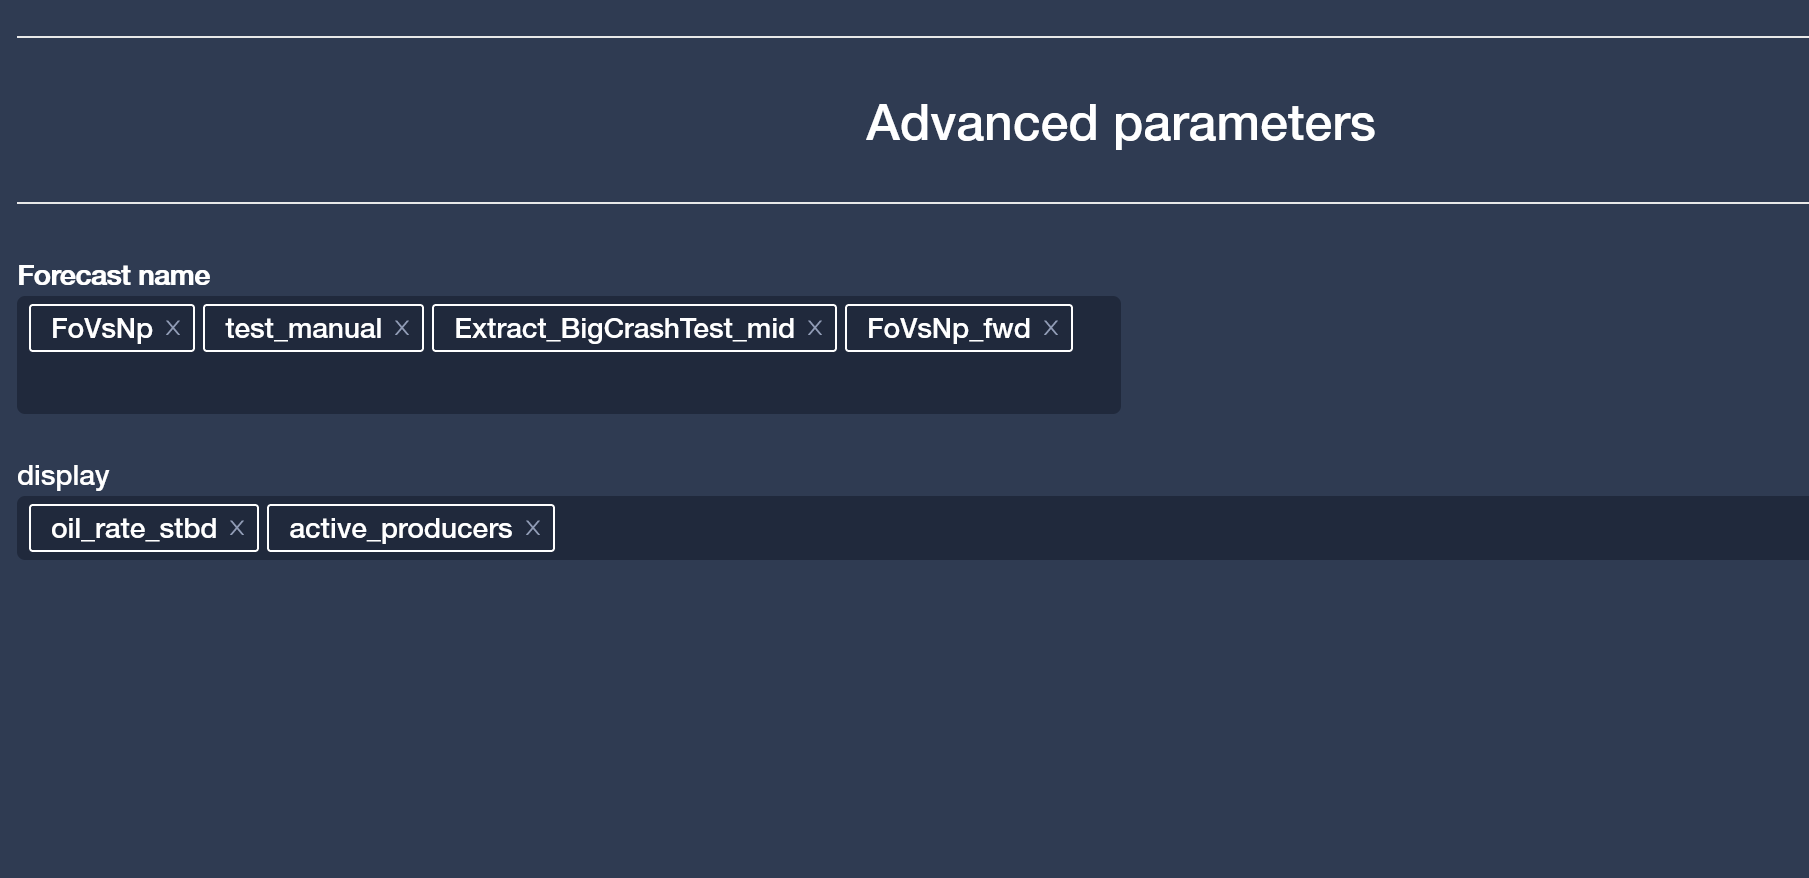
In the advanced settings, it possible to select the forecast to view and also the different plots available