Clustering
Overview
Cluestering is a Machine Learning technique that allows grouping a set of objects in such a way that objects in the same group (called a cluster) are more similar (in some sense) to each other than to those in other groups (clusters). It is a main task of exploratory data analysis, and a common technique for statistical data analysis, used in many fields, including pattern recognition, image analysis, information retrieval, bioinformatics, data compression, computer graphics and machine learning.
When trying to analyse production data, it is some time difficult to analyse the full time serie (oil rate / bsw / …) based only in few points (max, inital rate , last bsw,…) as it gives a truncated view of the behavior. That’s why FRF dimenstion reduction techniques coupled with clustering algorithms in order to group well behaviors based on the full profile.
In order to have a more complete set of data, FRF completes the production data with a reference forecast (the best guess for well behavior) in order to capture the behavior over a longer time. These clusters can be exported or added to analysis to link well behavior to static paramteres
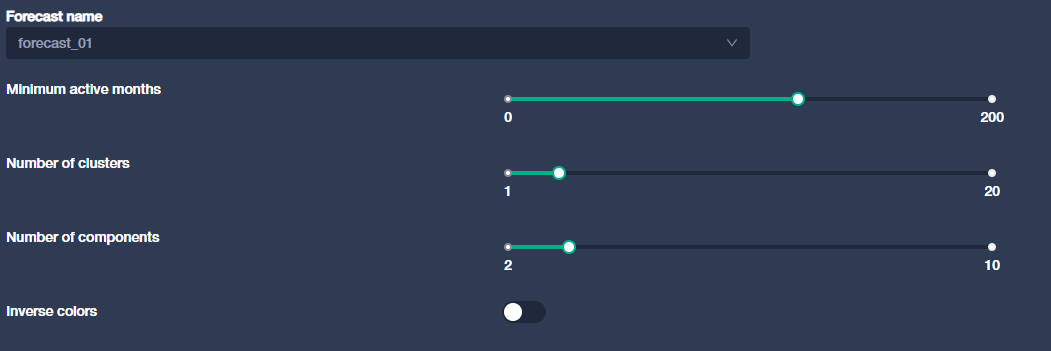
Parameters
Number of components : desired number components to compute with the PCA. The more complex is the behavior, the more componenets are needed in order to represent it correctly - generally 3 to 5 are sufficient in the case of production data
Number of clusters : desired number of cluster to compute with the Kmean
Minimum active months : Filter the wells with less than a certain number of month producing. They won’t be used for clustering
Y value : fluid on which you want to perform clustering (example : oil_rate_stbd, gas_rate_mscfd …)
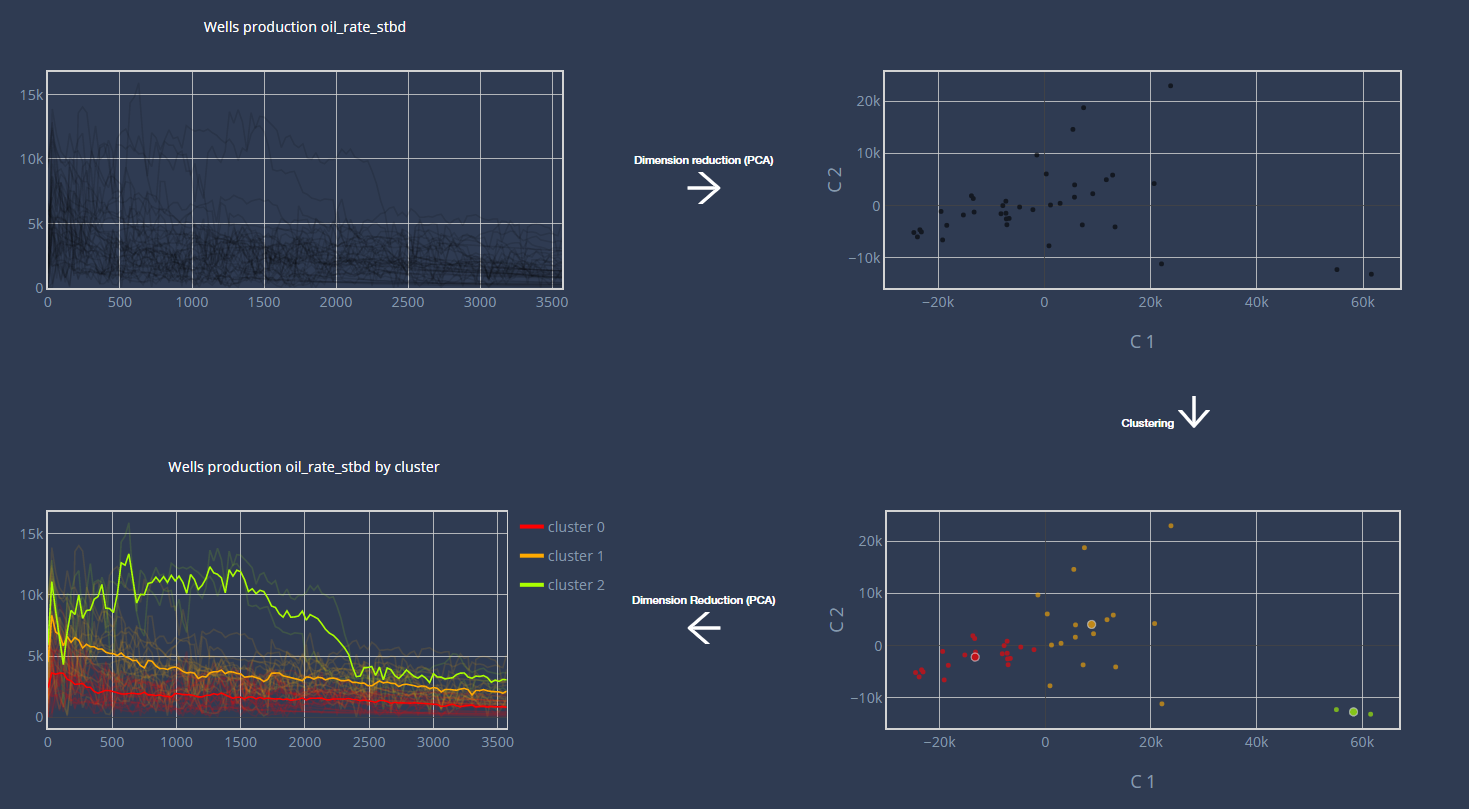
Workflow
This method will start with normalize the data based on the active production days. If there are null values in the dataset, the data will be replaced by 0 it y_value is a rate, or the tool will perform a forward fill (using the last value available) for rate and cumulative. Then the workflow will preform sequentially a Principal Component Analysis for dimension reduction and a clustering. For the clustering, we use the Kmean technique which aims to minimize the variance within each cluster.
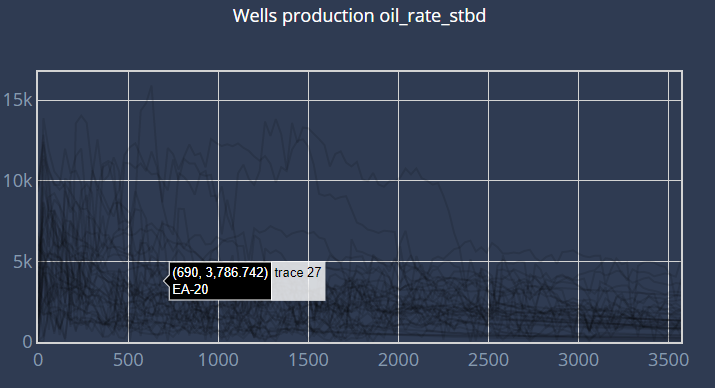
Data Normalisation
First, we plot the chosen fluid for all the wells according to the active days. In the plot, each curve corresponds to a well.
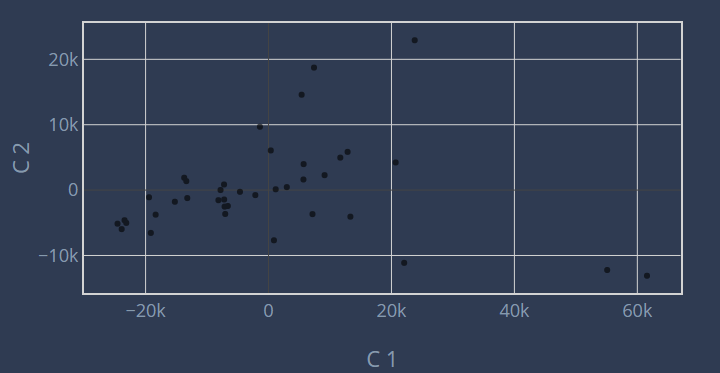
Dimension Reduction
After computing the PCA, we make a scatter plot of the 2 first components for all the wells.
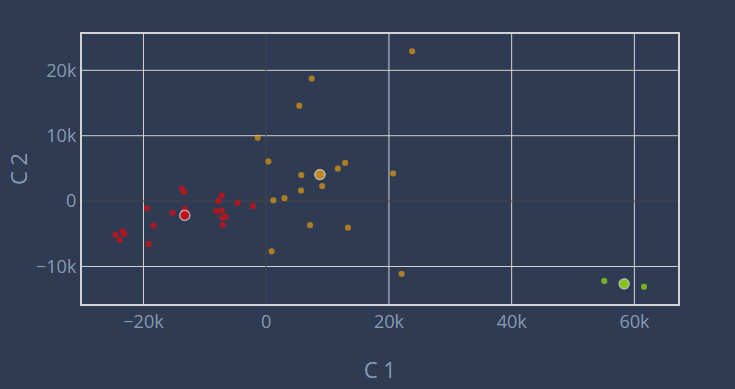
Clustering
Then we display the same scatter plot with the corresponding clusters. We also display the centroids of the clusters. (Warning : if you have many components with the PCA, the clusters may not look right, this is due to the fact that we only plot the 2 first components in the scatter)
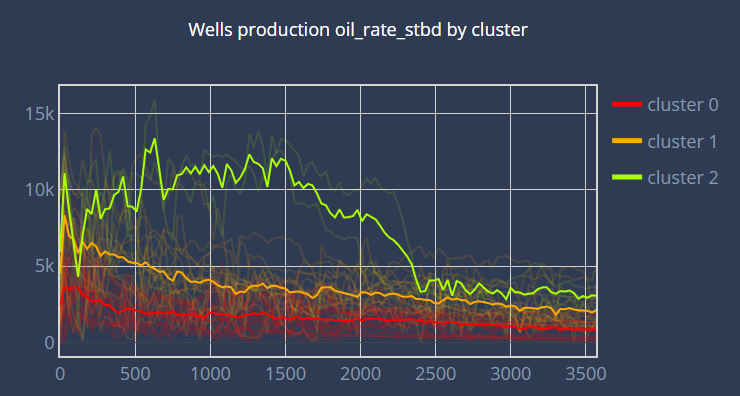
Final results
We finally plot the centroid’s curve of each cluster, in addition to the well’s curve production.
Overview workflow
Additional links:
For more information on clustering: