Multi-Realization
FRF allows to generate multi-realization workflow. Changing the different parameters would generate different forecast at the same time. It is possible to generate multi-realization in blind test or in foreward mode.
Workflow
The recommend workflow is always to start with blind test in order to check the production data against the selected workflows. Therefore it is possible within frf to generate blind test and validate or discard scenario based on the blind test. Finally the scenarios that passed the criteria will be run in foreward mode. Additionally some parameters like eco cutoff and uptime can be generated.
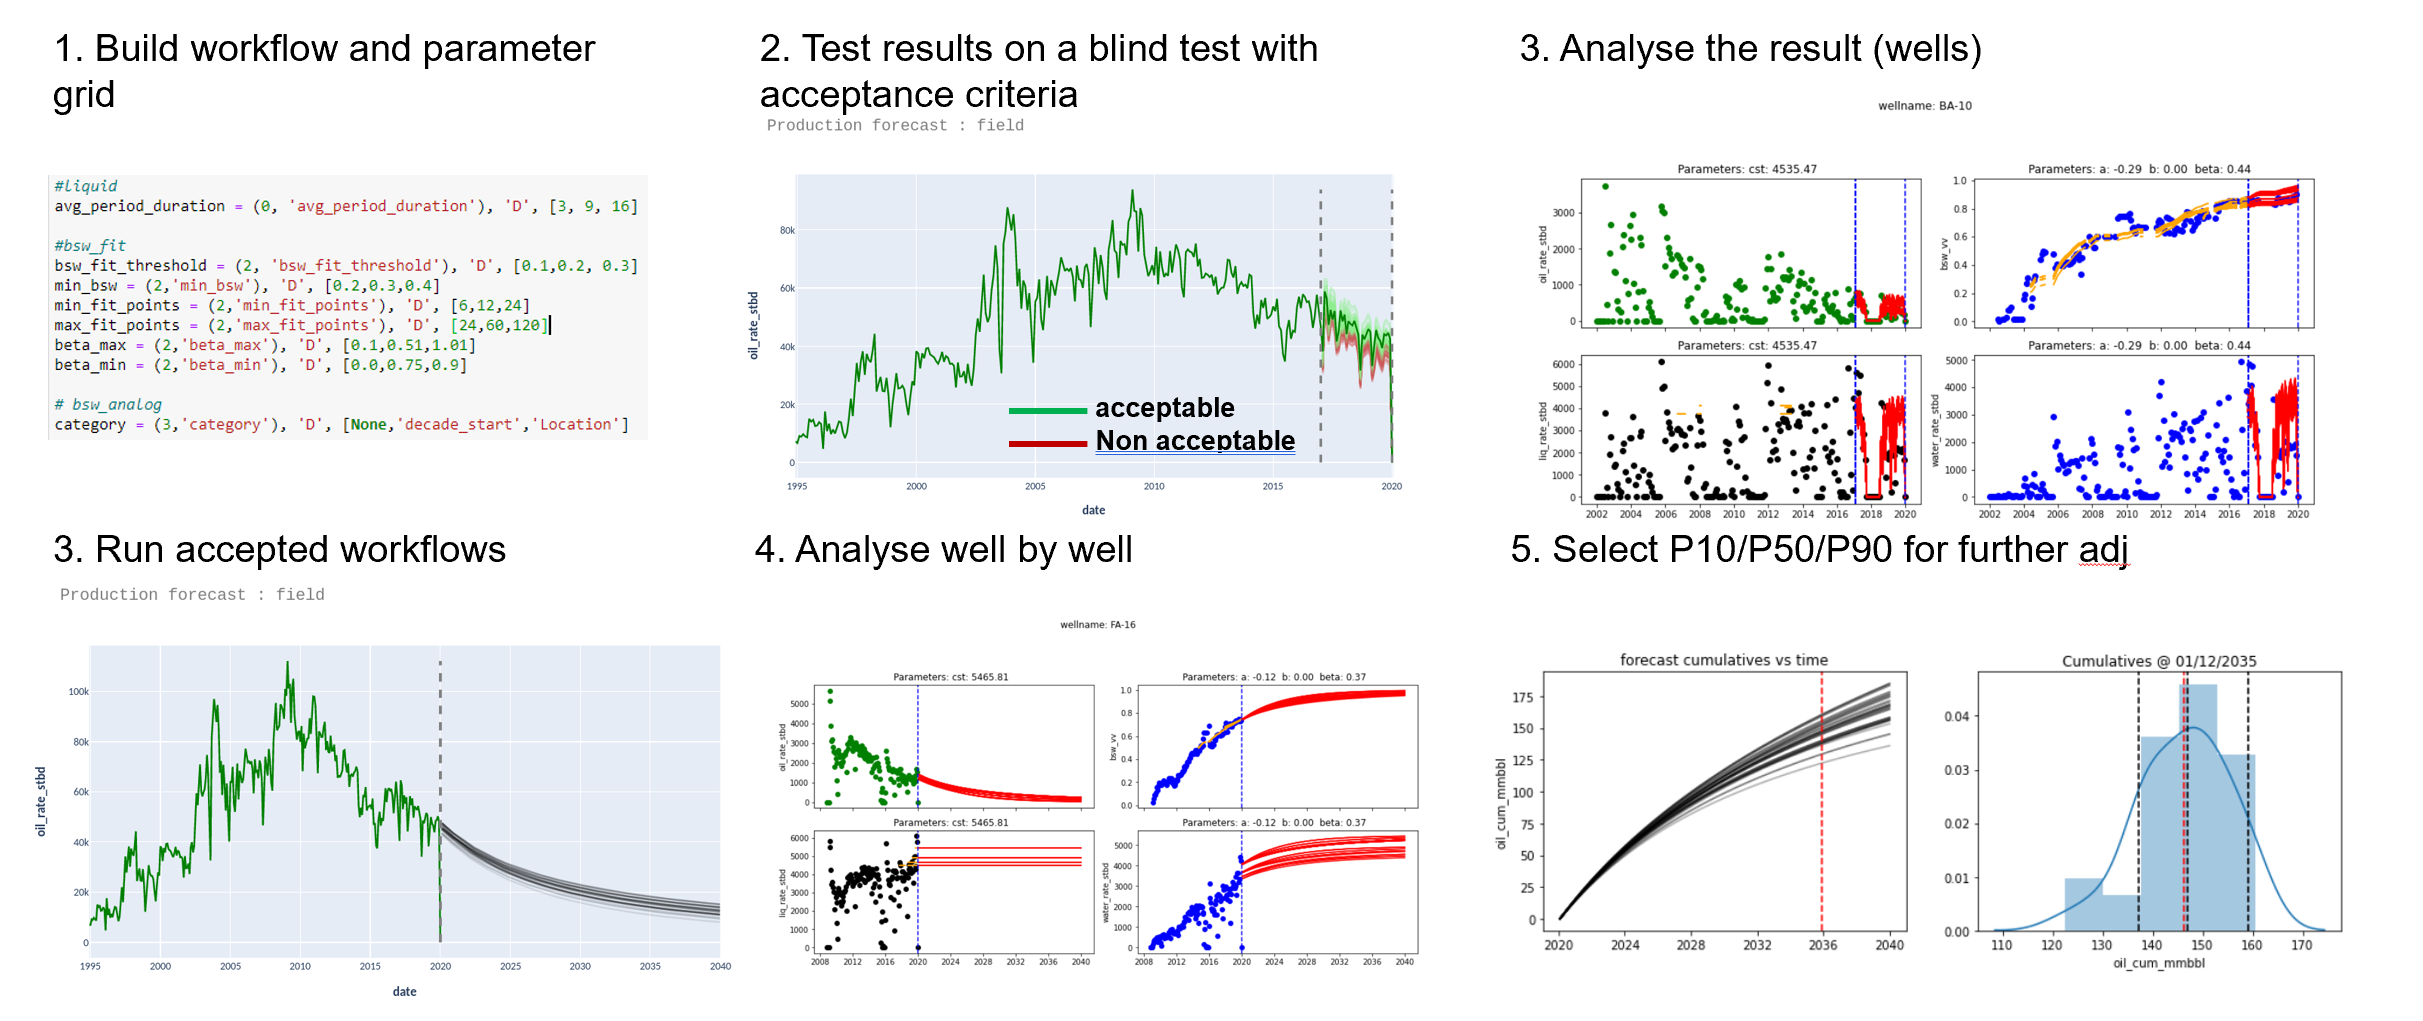
Also it is possible to directly run the forecast in foreward mode playing in the eco cutoff/uptime/… and the forecaster parameters (dca parameters/ analogs …)
In FRF App
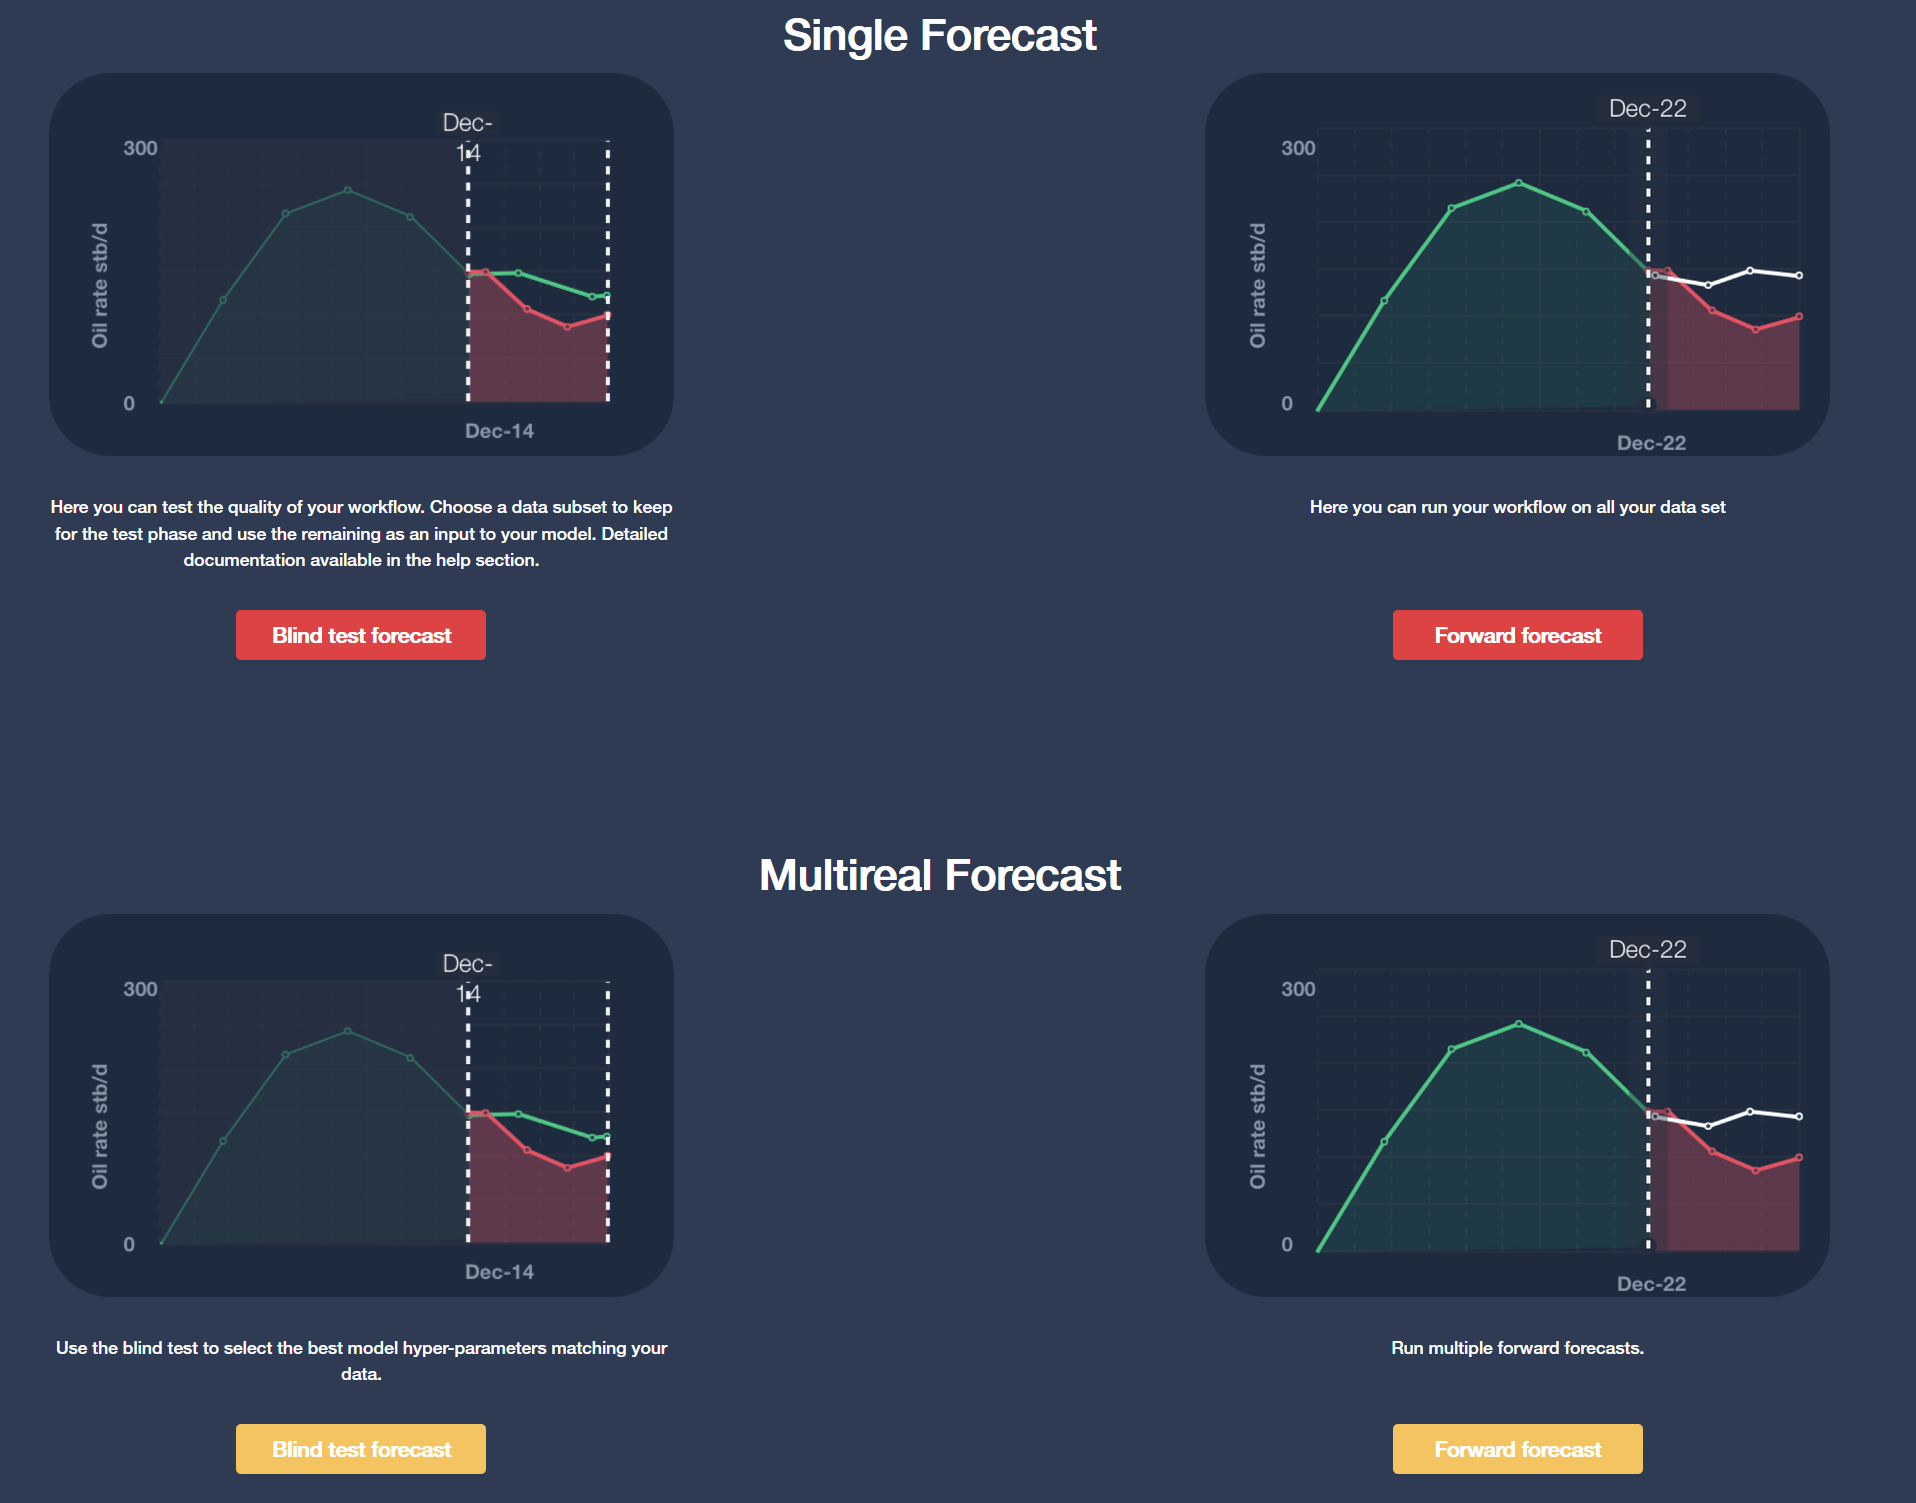
FRF web app replicates the workflow explained previously. First you need to select the multi-realization, either foreward mode or blind test
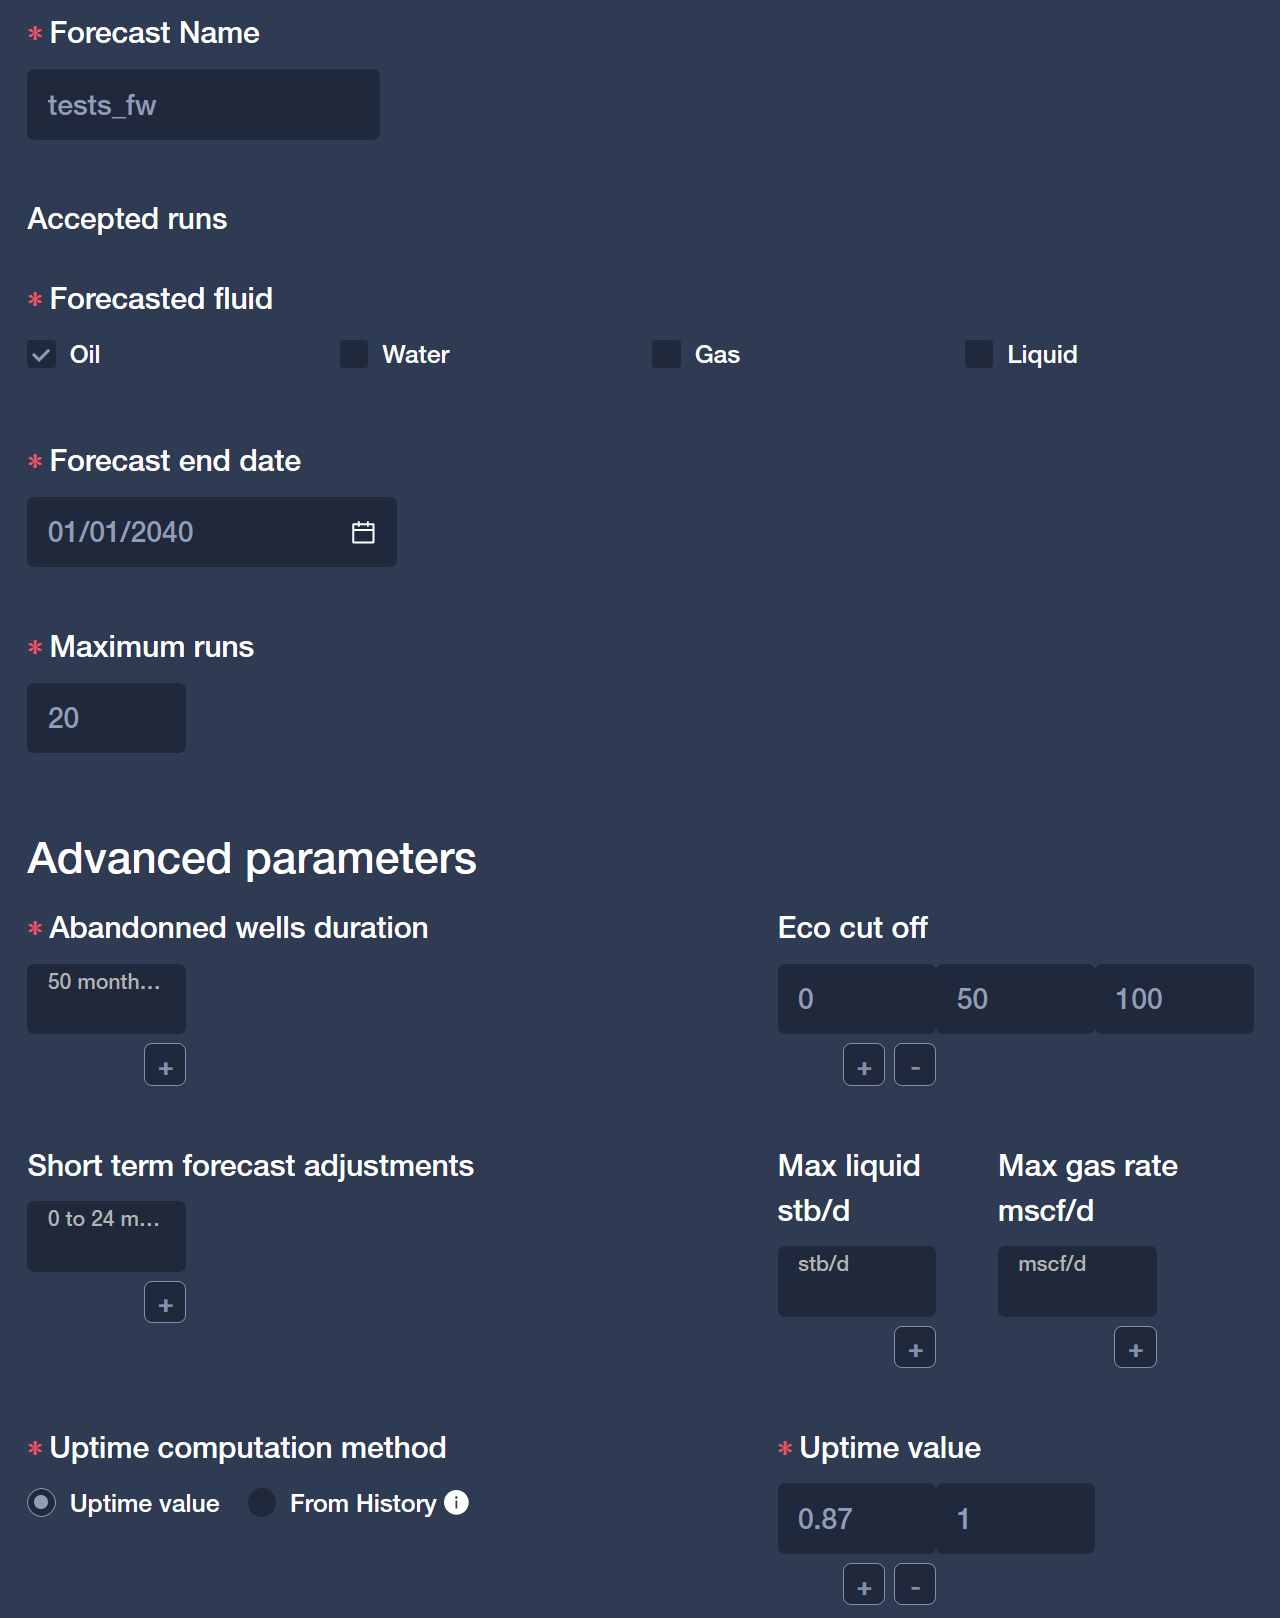
In both cases, there is a first step of setting the general parameters. The user needs to provide a maximum of run. The runs will be generated based on this number and the different parameters provided. Using the latin hypercube, a grid of runs will be generated which tries to cover the maxium amount of variables. However it is important to avoid choosing to many parameters compared to the maximum numboer of runs to allow the hypercube latin algorithm to work adequately.
Additionnaly to the number of runs, In foreward mode you can set-up the eco-cut and some additional parameters like the maximum liquid or gas rate.
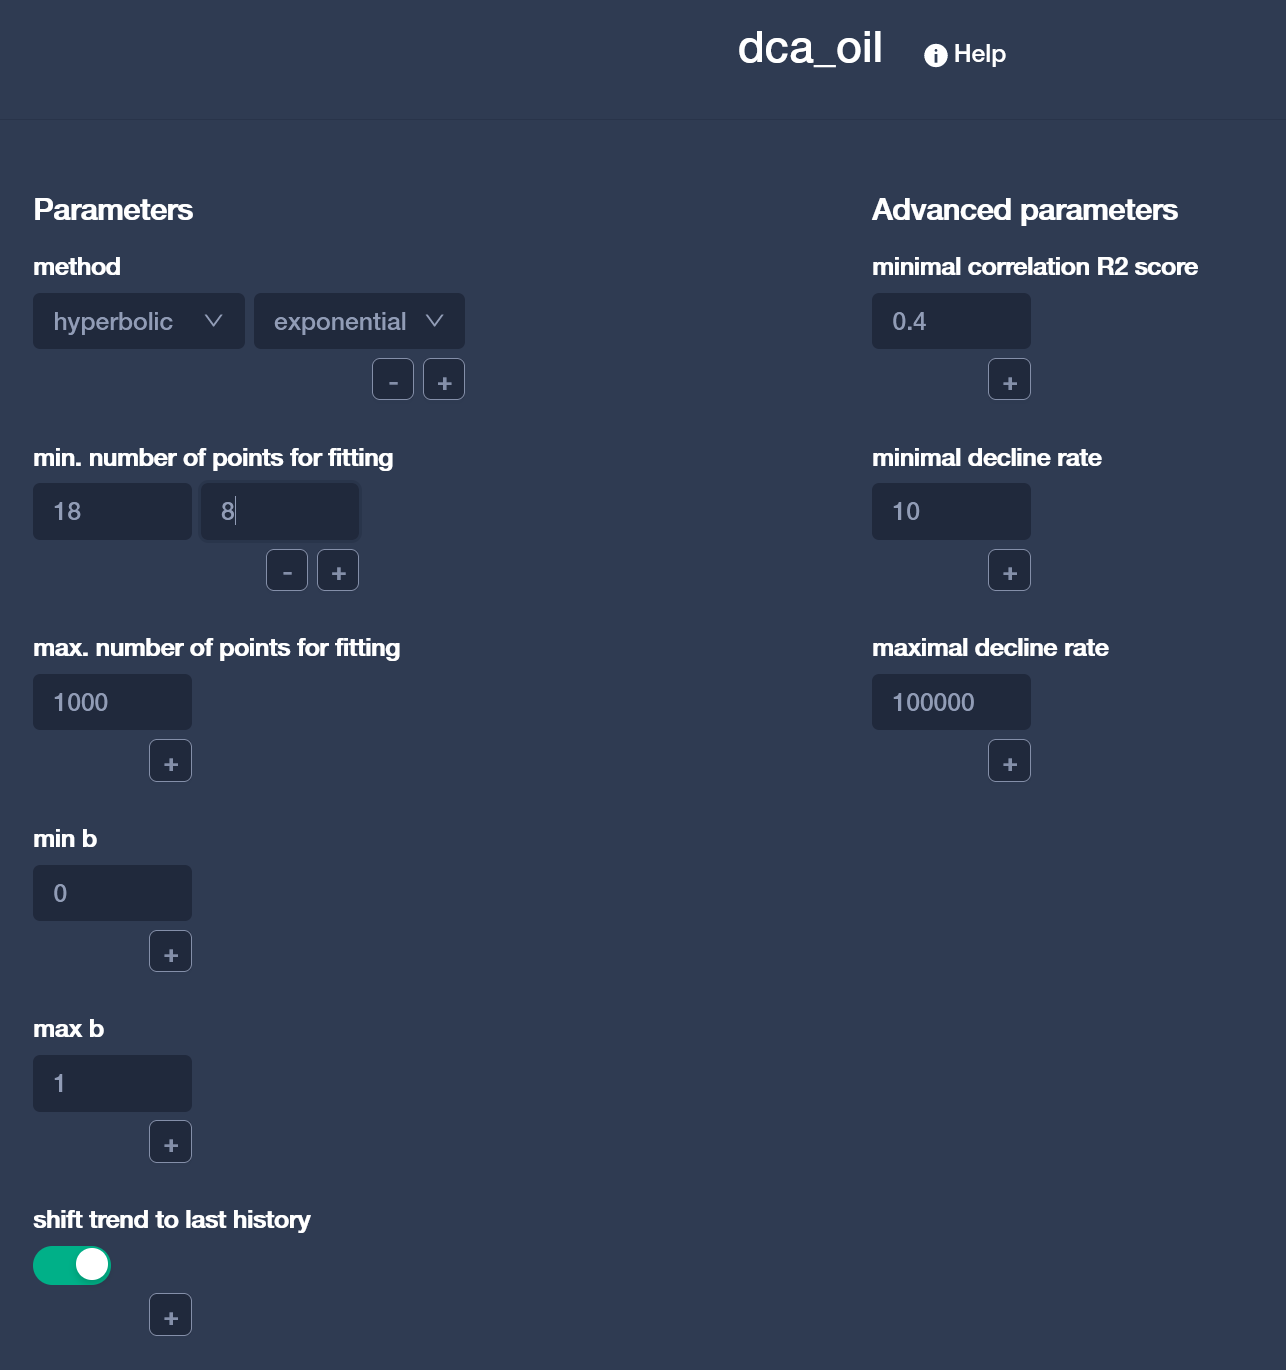
The second step of the workflow is to select the different parameters per forecaster. The example below show how to select different methods (exponential / harmonic /…)
Results
At the of the run, the result will appear. Depending of blind or forecast, the result will be slightly different
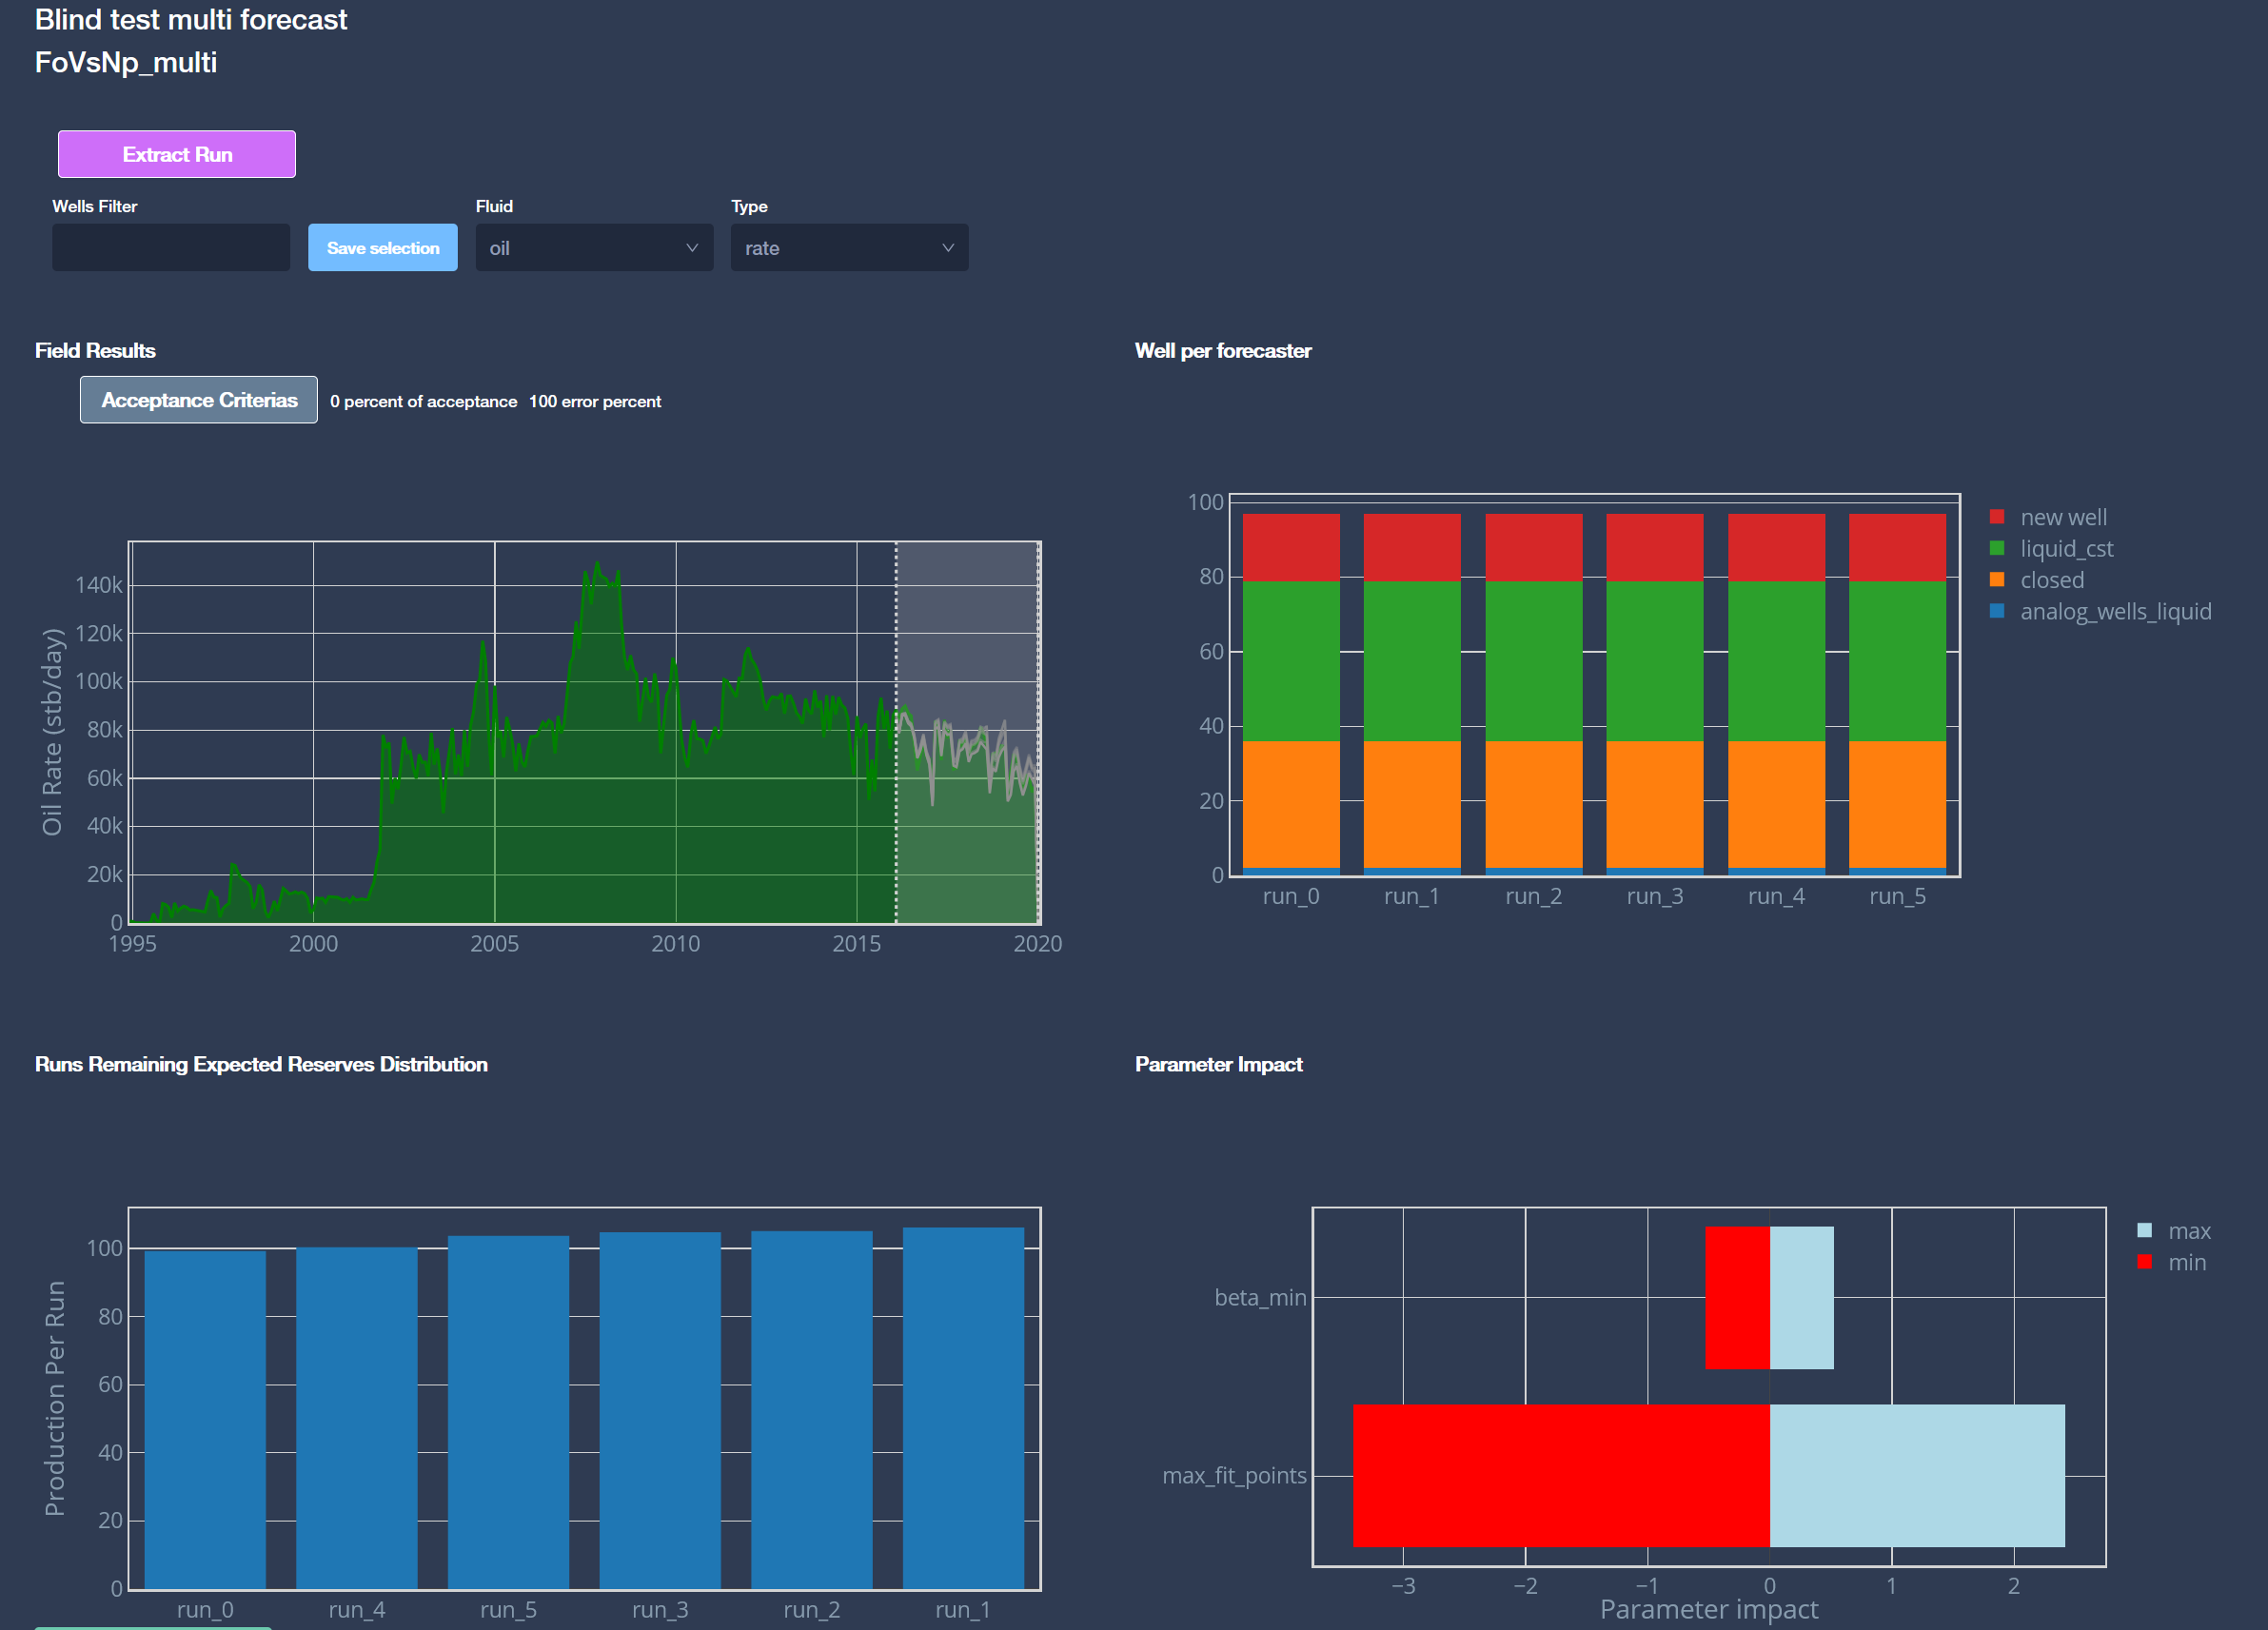
Blind-Test
In blind test, the result page shows the result of all the runs. An acceptance criteria can be set in order to select the accepted runs (Black accepted / gray discarded). The plots show the results per run (result blind test and number of wells per method). In the second rows there is a bar plot for the production during the blind test and toranado chart to show the sensitivity to the parameters.
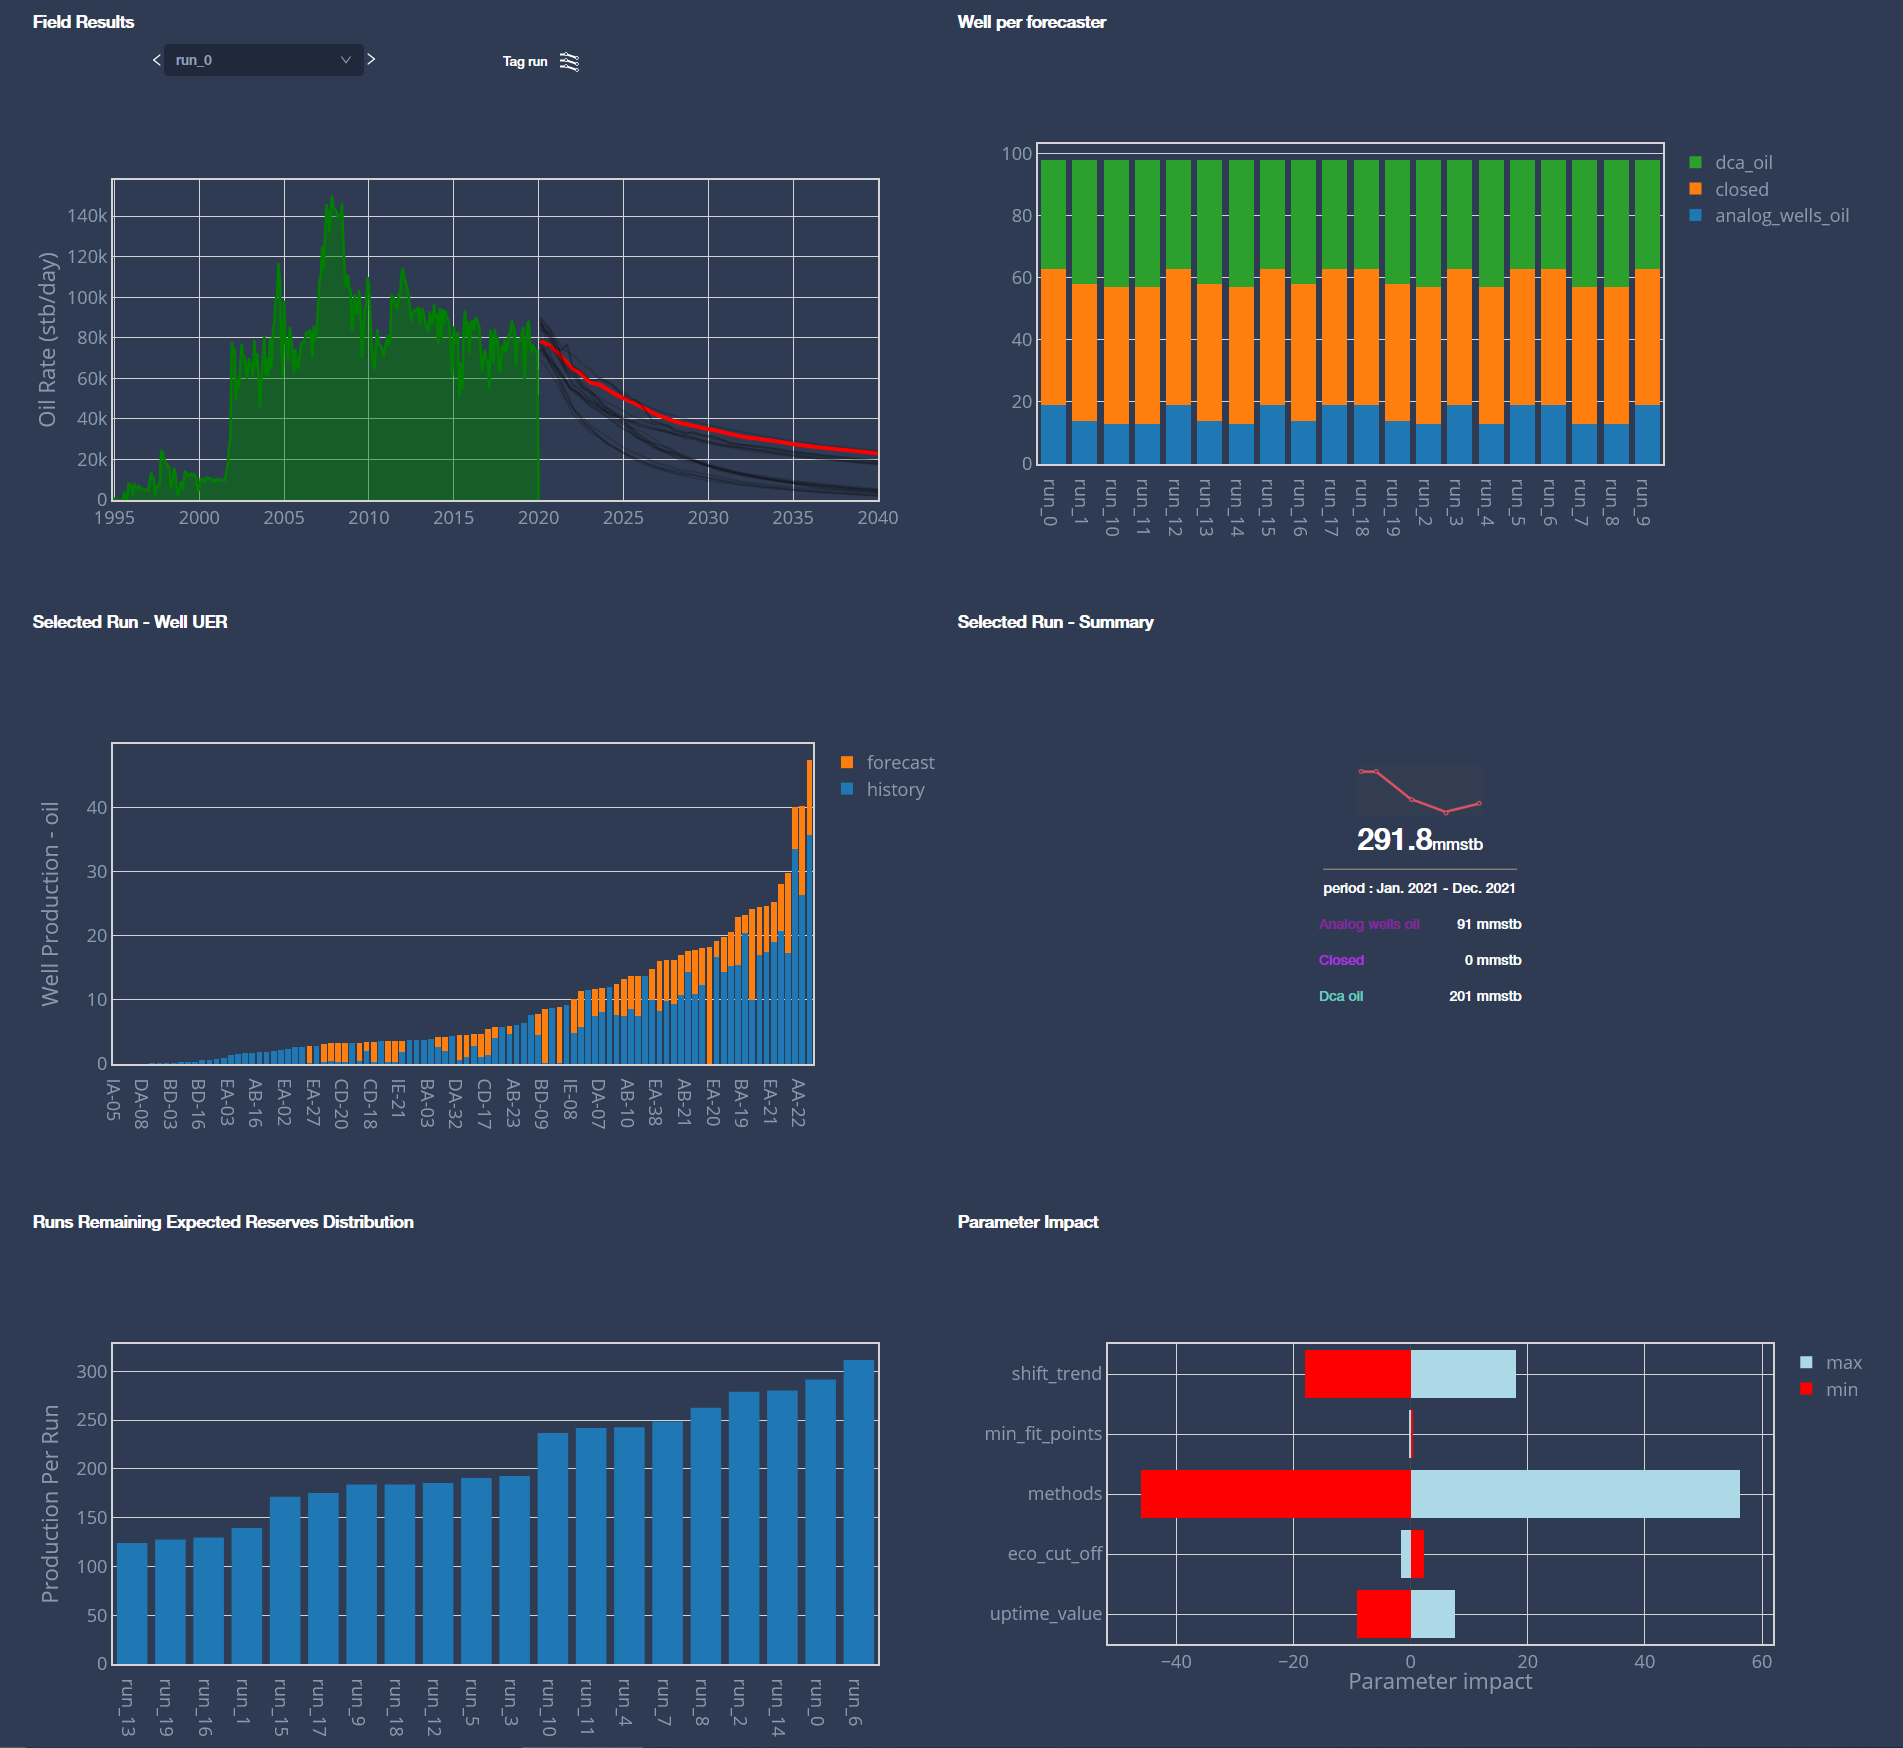
Foreward
In foreward mode, the result shows all the forecasts resunts. In the 2nd plot, the number of wells per methods. In the 2nd row, the well production per well and the overall result for the selected run In the 3rd row, the 1st plot shows the overall result per run and the Tornado chart showing the effect of each parameter
It is also possible to extract any run, to do some additional evaluation or manual modification. It is also possible to tag the runs (high/mid/low)